Find the levels
that actually hold.
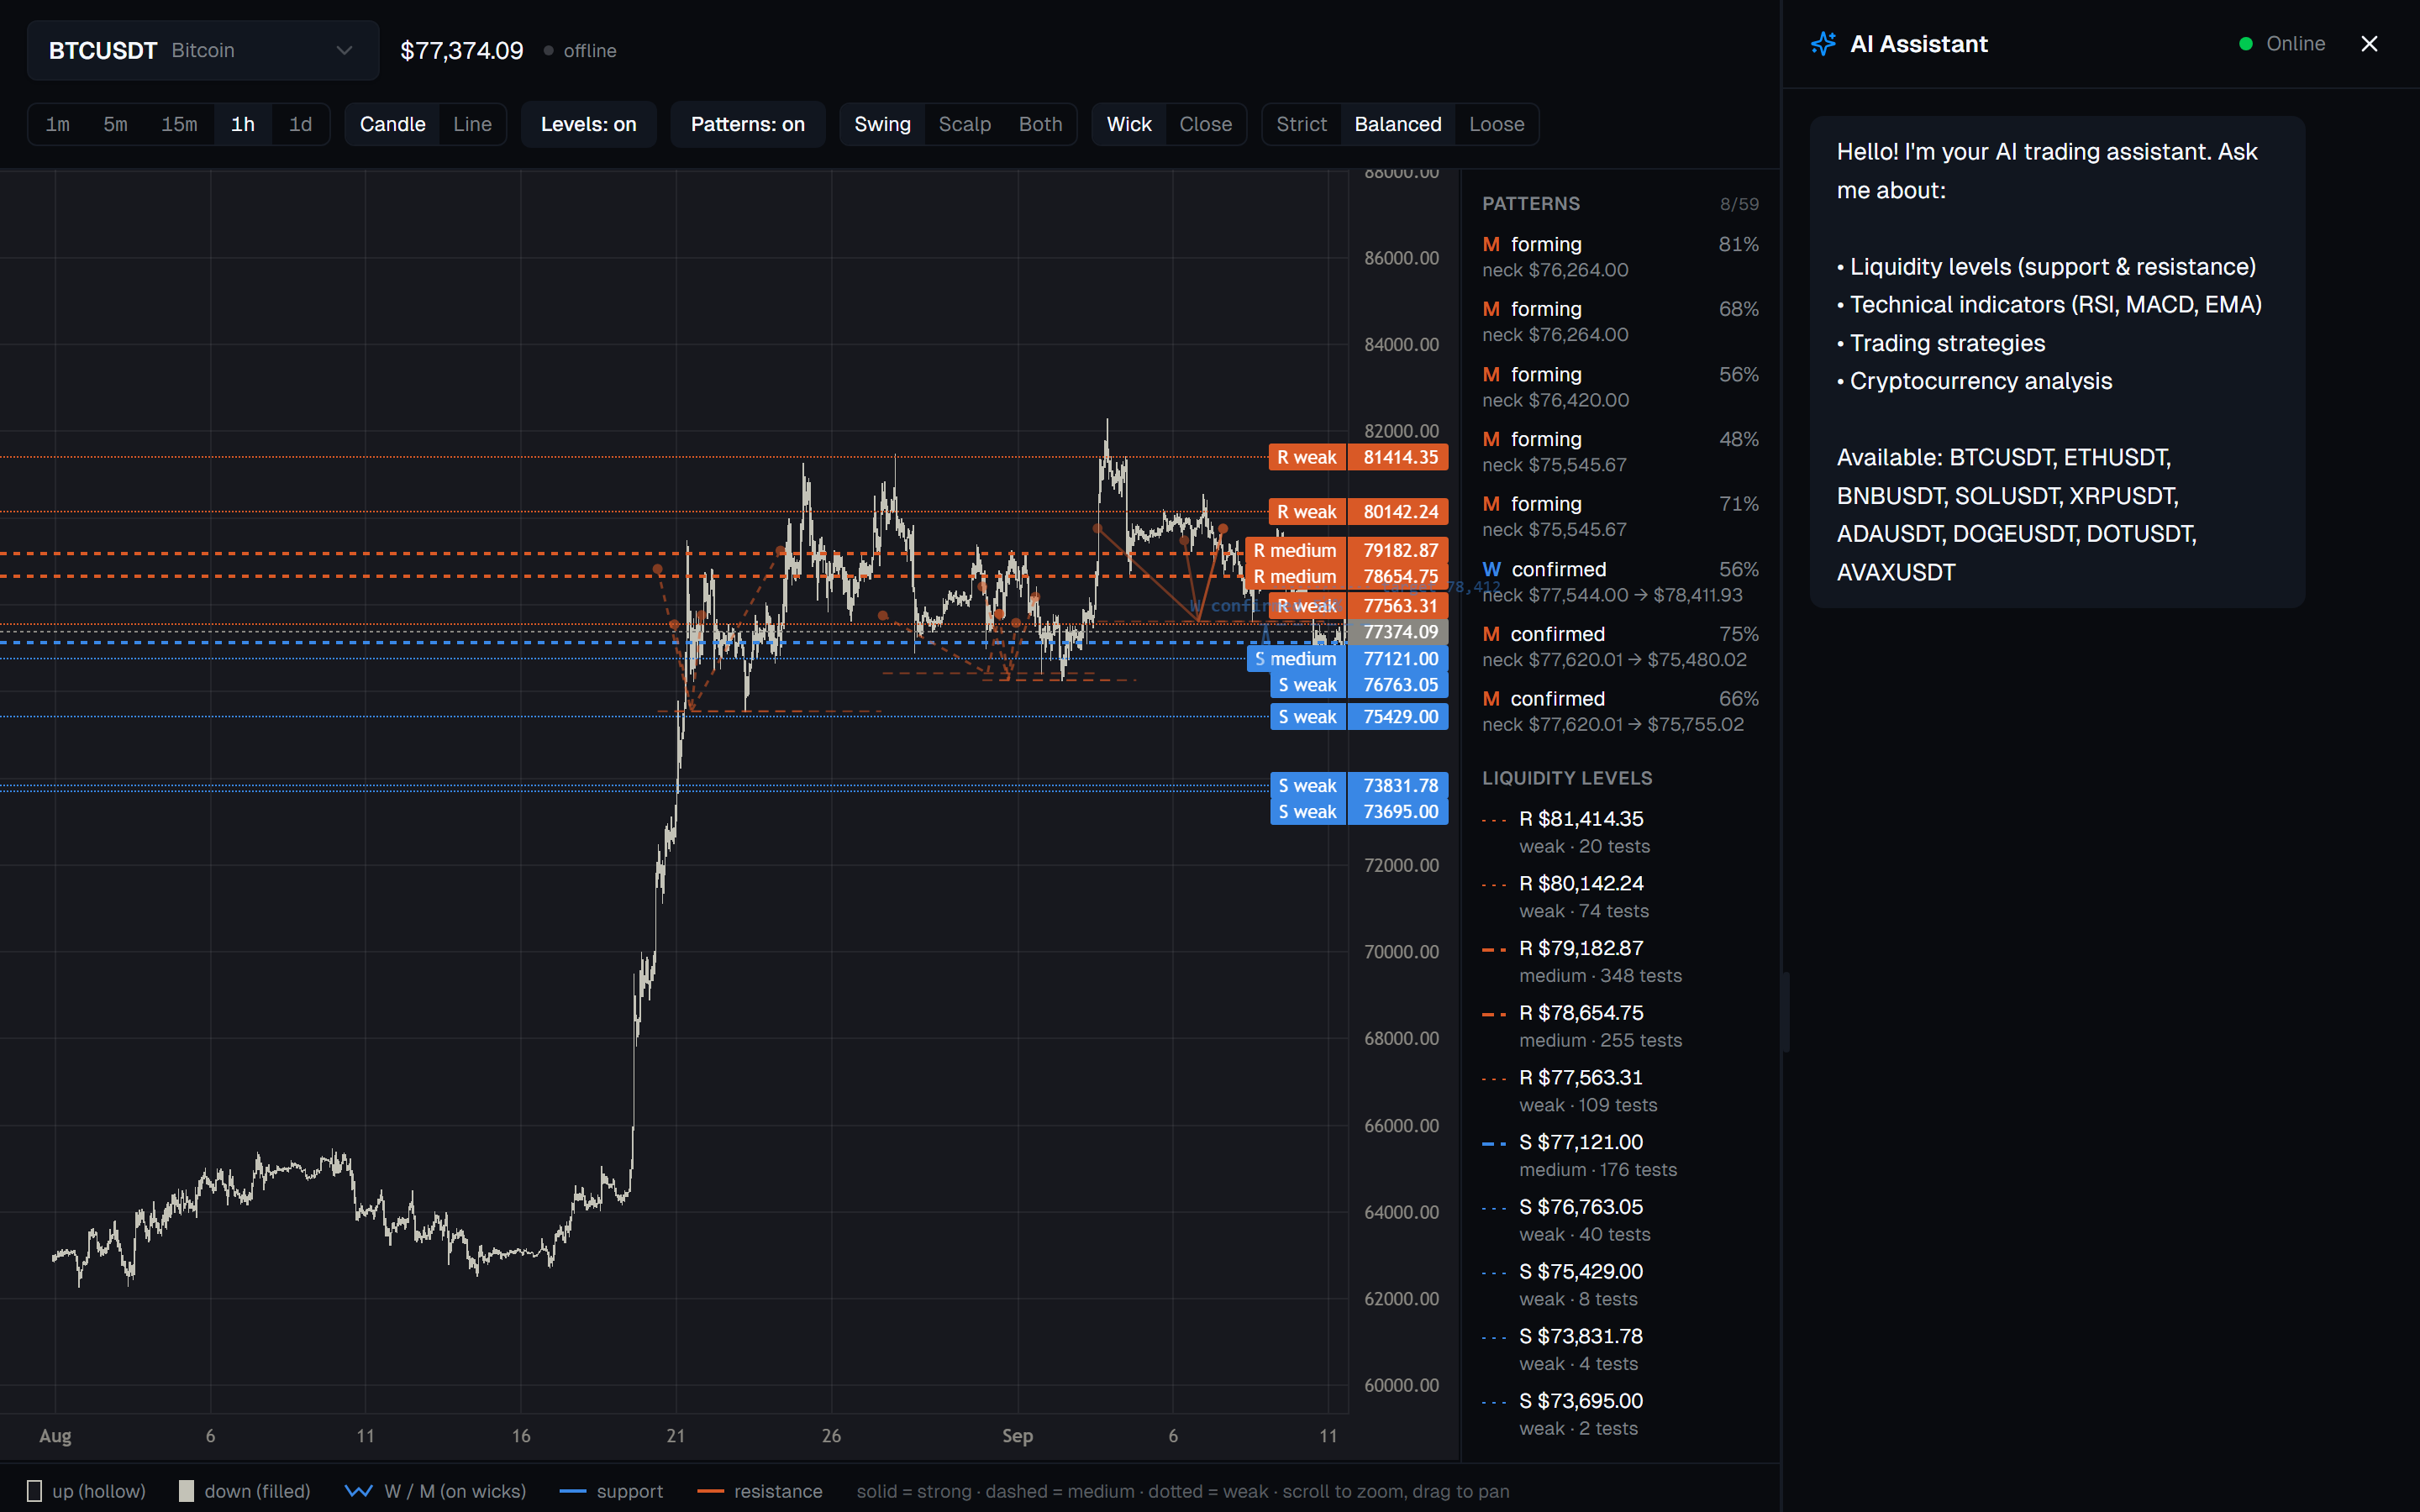
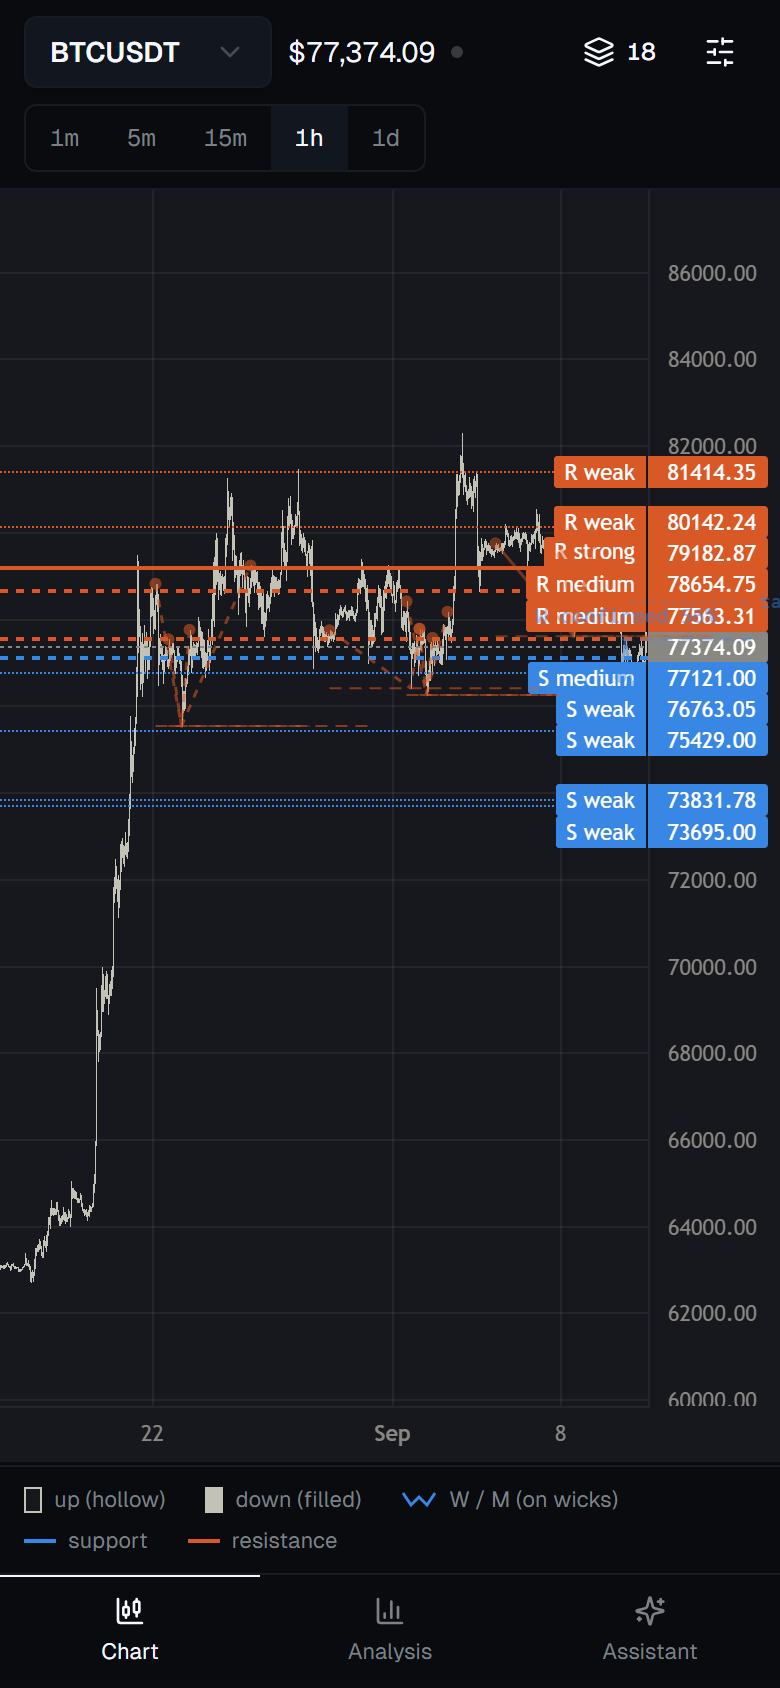
VibeTrading reads the last 100 hours of candles, clusters the prices the market keeps returning to, and marks them on your chart — with the number of times each one was tested.
How it works
Ask in plain English
“Where is liquidity sitting on BTC?” No query language, no indicator setup, no chart drawing.
Levels price has actually tested
100 hours of candles, clustered into the prices the market kept returning to. Each level carries how many times it was tested, so strength is measured, not asserted.
On the chart, in one click
Accept the levels and they are drawn on your chart with their strength encoded in the line itself. Reject them and nothing moves.
- R $65,102.44strong · 71 tests
- S $64,296.89strong · 82 tests
- S $63,040.40medium · 18 tests
Support sits below spot, resistance above. A level that price has broken through flips sides.
The product
Live today, in public beta.
- Stage
- Public beta
- Pairs
- Nine, live from Binance
- Access
- No signup
Liquidity levels
The prices the market keeps returning to, each carrying how many times it was tested. Strength is measured, not asserted.
W and M patterns
Double bottoms and tops tracked through their life — forming, approaching the neckline, confirmed by a close beyond it — so a setup is visible while it is still a setup.
Strategy alerts
Set a condition on a pattern or a level. It runs on the server and fires with the browser closed. Alerts only: nothing here places a trade.
Plain-English assistant
Ask where liquidity is sitting and get an answer you can mark on the chart. The model handles the conversation; it never computes a level.
Wallet sign-in
Rules belong to a wallet address, proven by signature. No email, no password, nothing for us to store or lose.
Public API
Every level and pattern the panel draws is available over a documented API, so the analysis can live inside your own tools.
api.vibetrading.club/docs
About
Built to measure, not to assert.
Most charting tools hand you an opinion drawn as a line. VibeTrading was started to replace that with a count: how many times price actually came back to a level, how far a pattern is through its life, all expressed in the chart's own units so the answer holds on a one-minute chart and a daily chart alike.
The analysis is deterministic and every score can be explained. The plan is to grow it from something you read into something that watches the market for you and acts when a condition is met — starting with alerts, and building outward from there.
- Founded
- 2025
- Status
- Early-stage company, incorporation in progress
- Stage
- Public beta
Founder
- Varun SinghCo-founder, VibeTradingLinkedIn profile
Roadmap
- Live
Levels, patterns and strategy alerts
Liquidity levels with test counts, W and M patterns tracked through their lifecycle, and server-side rules that alert when a condition is met - with the browser closed.
- In testing
Android app on Google Play
The phone layout packaged as an installable app. In closed testing ahead of a production listing.
- Next
Alerts by push notification
Rule signals delivered to the phone rather than only to an open tab.
- Planned
Rules that act, not only alert
Phase two of the strategy engine. Today a rule can only raise an alert; nothing places a trade.